
Following the KDE Plasma 6.6 Beta from two weeks ago, a second beta of the upcoming Plasma 6.6 desktop is now available for testing. KDE Plasma 6.6 stable remains on-track for a mid-February release…
Category Archives: Linux
A critical GnuPG security update
There is a new GnuPG update for a “critical security bug
” in recent
GnuPG releases.
A crafted CMS (S/MIME) EnvelopedData message carrying an oversized
wrapped session key can cause a stack buffer overflow in gpg-agent
during the PKDECRYPT–kem=CMS handling. This can easily be used
for a DoS but, worse, the memory corruption can very likley also be
used to mount a remote code execution attack. The bug was
introduced while changing an internal API to the FIPS required KEM
API.
Only versions 2.5.13 through 2.5.16 are affected.
Google Axion CPU Performance With The New Google Cloud N4A Instances
Back in 2024 Google rolled out their Axion in-house ARM processors with the Google Cloud C4A instance type. Today they are expanding their Axion offerings in Google Cloud with the N4A instances now out of preview. The Google Cloud N4A instances are designed for scale-out web servers and microservices, containerized applications, back-end application services, databases, data analytics, and cost-effective development/staging/testing environments.
The GNU C Library is moving from Sourceware
GNU C Library maintainer Carlos O’Donell has announced
that the project will be moving its core services away from Sourceware in favor of services hosted
at the Linux Foundation.
While it was clear to the GNU Toolchain leadership that
requirements were coming to improve the toolchain cyber-security
posture, these requirements were not clear to all project
developers. As part of receiving this feedback we have worked to
document and define a secure development policy for glibc and at a
higher level the GNU Toolchain. While Sourceware has started
making some critical technical changes, the GNU Toolchain still
faces serious, systemic concerns about securing a global, highly
available service and building a sustainable, diverse sponsorship
model.
This has been a long-running discussion; see this 2022 article for some background.
Systemd Founder Lennart Poettering Announces Amutable Company
Systemd founder and lead developer Lennart Poettering announced the creation of a new company called Amutable. The Amutable company being led by Chris Kühl (CEO), Christian Brauner (CTO) and Lennart Poettering (Chief Engineer) will be focused on delivering determinism and verifiable integrity to Linux systems…
Godot 4.6 Open-Source Game Engine Released With Workflow Improvements
Godot 4.6, a free and open-source game engine, is out with improvements to the editor, performance optimizations, and usability enhancements across everyday game development tasks.
[$] Implicit arguments for BPF kfuncs
The kernel’s “kfunc” mechanism is a way of exporting kernel functions so
that they can be called directly from BPF programs. There are over 300
kfuncs in current kernels, ranging in functionality from string processing
(bpf_strnlen())
to custom schedulers (scx_bpf_kick_cpu())
and beyond. Sometimes these kfuncs need access to context information that
is not directly available to BPF programs, and which thus cannot be passed
in as arguments. The implicit
arguments patch set from Ihor Solodrai is the latest attempt to solve
this problem.
TigerVNC 1.16 Released With “w0vncserver” For Sharing Wayland Desktop Sessions
TigerVNC 1.16 is out today for this high performance, multi-platform VNC server and client implementation. Most notable with TigerVNC 1.16 is “w0vncserver” as a new server for sharing Wayland desktops…
Zlib-rs Declares A Stable & Complete API For This Rust-Based Zlib Implementation
Following the release of zlib-rs 0.6 last week, the developers behind this Rust-based Zlib implementation have declared their API stable and complete…
Dabao Evaluation Board to Showcase Open-RTL Baochip-1x RISC-V MCU
Baochip has previewed the Baochip-1x, a mostly open RTL, RISC-V–based microcontroller fabricated on TSMC’s 22 nm process. Designed with openness and verifiability in mind, the MCU integrates a VexRiscv application core running at up to 350 MHz, alongside a quad-core I/O accelerator cluster clocked at 700 MHz. The Baochip-1x uses a VexRiscv RV32IMAC processor with […]
Xfwl4 Being Developed As New Wayland Compositor For Xfce
Xfce developers are using their donations from the community to fund a longtime core developer to create Xfwl4, an entirely new Wayland compositor for Xfce…
Vulkan VK_EXT_present_timing Merged To Mesa 26.1 For X11 & Wayland
The Vulkan EXT_present_timing was in development for years to help avoid game stuttering and released this past November with Vulkan 1.4.335. This significant extension as of today has been wired up in Mesa 26.1-devel for the key Vulkan drivers and working on both X11 and Wayland…
Just the Browser is just the beginning: Why breaking free means building small
Privacy tools are a start, but real freedom lives in the digital outskirts of the webOpinion The Net is born free, but everywhere is in chains. This is a parody of Jean-Jacques Rousseau’s 1762 book The Social Contract where he said the same about humans, but it’s nonetheless true. The Net is built out of open, free protocols and open, free code. Yet it and we are bound by the rulemakers who build the services and set the laws of the places we go and the things that we do, not to our advantage.…
New Intel Linux Code For DG2 Graphics Can Improve Performance As Much As “A Whopping 260%”
A set of 18 patches were merged overnight to Mesa 26.1 for working around graphics corruption on Meteor Lake and DG2/Alchemist class graphics hardware. Not only are some graphics corruption issues worked around but for that hardware there is as much as “a whopping 260%” performance improvement observed for some graphics workloads…
ThinkPads On Linux Appear Nearly Ready For Improved Trackpoint Doubletap Handling
Being worked on for a while by Lenovo engineer Vishnu Sankar is nicely handling support for double-tap functionality with TrackPoints on ThinkPads under Linux. The sixth iteration of this enablement work was posted today and is just documentation updates, so it’s looking like this new TrackPoint doubletap code could soon be crossing the threshold for the mainline Linux kernel…
Updated Linux Patches For Managing Out-Of-Memory Behavior Via BPF
Being worked on since last year by Google engineer Roman Gushchin was the latest attempt for the Linux kernel to support managing the out-of-memory “OOM” behavior using BPF programs. It’s been a while since there has been anything new to report on that front but published overnight is the latest iteration of those patches…
Picolibc Picks Up RISC-V Improvements, Hexagon Support & Better POSIX Compliance
Keith Packard published Picolibc 1.8.11 on Monday as the newest release for his C library designed for embedded 32-bit and 64-bit platforms. Picolibc continues tacking on new CPU architecture support and other features for this project that started out as a conglomeration of the Newlib and AVR Libc C library codebases…
How to strategically plan your computing curriculum
Traditionally, curriculum planning has often looked like a linear list: Topic A leads to Topic B, which leads to Topic C. However, as educators we know that learning rarely happens in such a simple, linear way. Concepts are regularly covered in different overlapping topics, and students can often take different routes to reach the same destination.
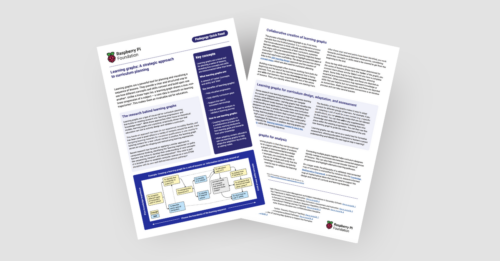
In today’s blog we’re exploring learning graphs, a helpful tool that you can use to plan your computer science curriculum. We’ll share how they can provide educators with a clear, structured way to visualise students’ non-linear progression in a subject.
We also share our new Pedagogy Quick Read about learning graphs, which you can download for free to:
- Find practical tips on how you can use learning graphs to design your curriculum
- Read a summary of the research behind them
What is a learning graph?
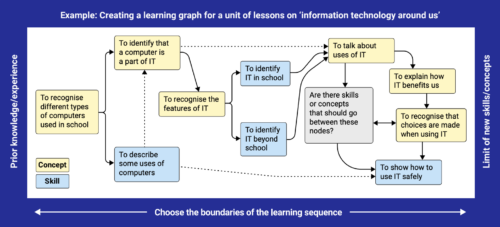
A learning graph is a visual tool for curriculum planning that moves beyond simple lists. At its core, a learning graph is a network of ‘nodes’ (specific concepts and skills) and ‘links’ (the connections between them).
Learning graphs build on research into ‘learning progressions’ and ‘knowledge maps’. They are a practical tool that educators can use to design and validate different curricula. For example, they can help teachers to:
- Visualise and map progression
- Identify curriculum gaps, so educators can shape and restructure learning experiences as necessary
- Ensure the use of consistent terminology
- Sequence learning and manage cognitive load
How to create a learning graph
Building a learning graph is an iterative process that helps you think critically about how different parts of your curriculum relate to each other.
Nodes and links
The first step in creating a learning graph is often to identify your start and end nodes. First, you consider the key concepts and skills that your learners must acquire by the end of a series of lessons. This gives you some end nodes to work towards. Then, you think about learners’ existing knowledge, to help determine your start point. You then work backwards and forwards between these points to identify the different nodes that learners need to cover to get from the beginning to the end.

Once you have determined your nodes, you add them to your graph and connect them via ‘links’ until your graph is complete. Where knowledge of particular concepts or skills is essential for learning others, you connect the nodes with solid lines. For prior learning that is helpful but not essential, you use dotted lines.
When developing a learning graph, there isn’t a specific level of granularity that you have to work towards. Progression can be as detailed or as high-level as you need. This makes them a helpful tool in creating bespoke learning experiences and curricula for learners.
Collaboration and development
It is most effective to design learning graphs collaboratively within a small group. This allows curriculum designers to discuss their ideas and challenge each other’s thinking, which helps hone the designs.

When creating learning graphs, it can be extremely useful to use a tool that is dynamic and allows you to move elements and make changes quickly and easily. At the Raspberry Pi Foundation, our team has experimented with a range of tools, including using editable shapes in Google Slides, collaborating in Figma, and arranging sticky notes on paper. We recommend finding a tool that works for you and the educators you are working with. Although it can work, we suggest avoiding using a pen and paper if possible, as designs can quickly become messy and difficult to navigate after lots of iterations.
The process of designing learning graphs has strong links to ABC learning design and the creation of concept maps, which can also be used for curriculum planning.
Learning graphs in your teaching
Once created, learning graphs can support you to design and adapt your curricula and assess your students’ learning.
For example, to help sequence learning, you can track or predict the paths through a topic most commonly taken by learners and use this to inform your curriculum design.
If you are adapting a unit of work for a specific qualification or new context, you can prune nodes that are not relevant and add any further knowledge and skills your learners need, then use the new learning graph to guide you as you develop the unit.
Finally, you can assess which node a learner has completed, and use this to identify the next logical step in their learning, ensuring the difficulty level is always appropriate.
Using learning graphs to support analysis
Another benefit of learning graphs is that they can be combined with lots of other frameworks, for example, Bloom’s taxonomy. This allows you to better assess and validate the learning journeys you have designed, and ensure that they are suitably accessible, challenging, and relevant for your learners.

There are a number of ways that you could link your learning graphs to other frameworks, such as annotating nodes with extra information, or using colour coding.
As well as working with learning graphs for specific learning experiences, you can connect multiple learning graphs together and analyse how they intersect. This can help identify inconsistencies between connected sequences of lessons. It can also help uncover broader themes of progression and highlight alternative learning pathways you might not have considered.
Find out more about learning graphs
If you’d like to find out more about learning graphs, you can download our Pedagogy Quick Read for free.
To find out more about how we use learning graphs when planning curriculum resources at the Raspberry Pi Foundation, take a look at our teaching and learning design principles.
The post How to strategically plan your computing curriculum appeared first on Raspberry Pi Foundation.
GParted 1.8 Partition Editor Improves FAT Handling
GParted 1.8 partition editor is out with multiple crash fixes, improved FAT handling, and safer file system copying.
How one developer used Claude to build a memory-safe extension of C
Robin Rowe talks about coding, programming education, and China in the age of AIfeature TrapC, a memory-safe version of the C programming language, is almost ready for testing.…