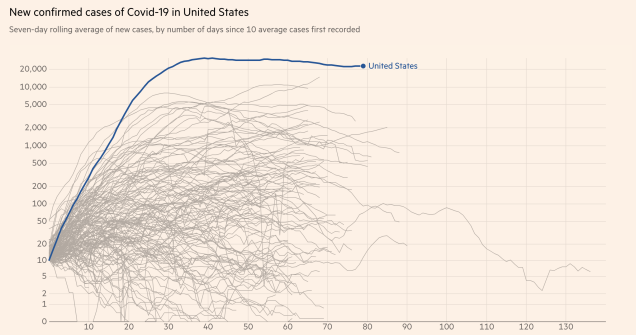
When you see a flat line on a graph, it’s tempting to think, “Oh hey, at least the situation isn’t getting any worse!” But one of the common types of charts we see for COVID-19 is of new cases per day. In that case, a flat line means that things are, in fact, still getting worse.
Source: LifeHacker – How to Read a COVID-19 Graph