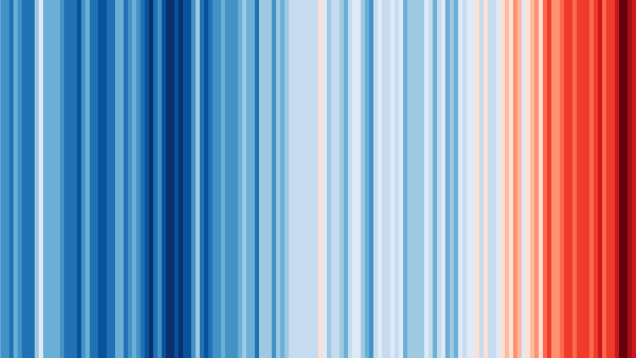
When University of Reading climate scientist released his warming stripes visualization for the globe last year, people freaked (in a good way). The minimalist graphic stripped out unnecessary clutter and told the story of global warming in blue and red stripes.
Source: Gizmodo – This Striking Climate Change Visualization Is Now Customizable for Any Place on Earth
